
Revised maps of carbon emissions from electricity, mains gas and heating fuels used in the home
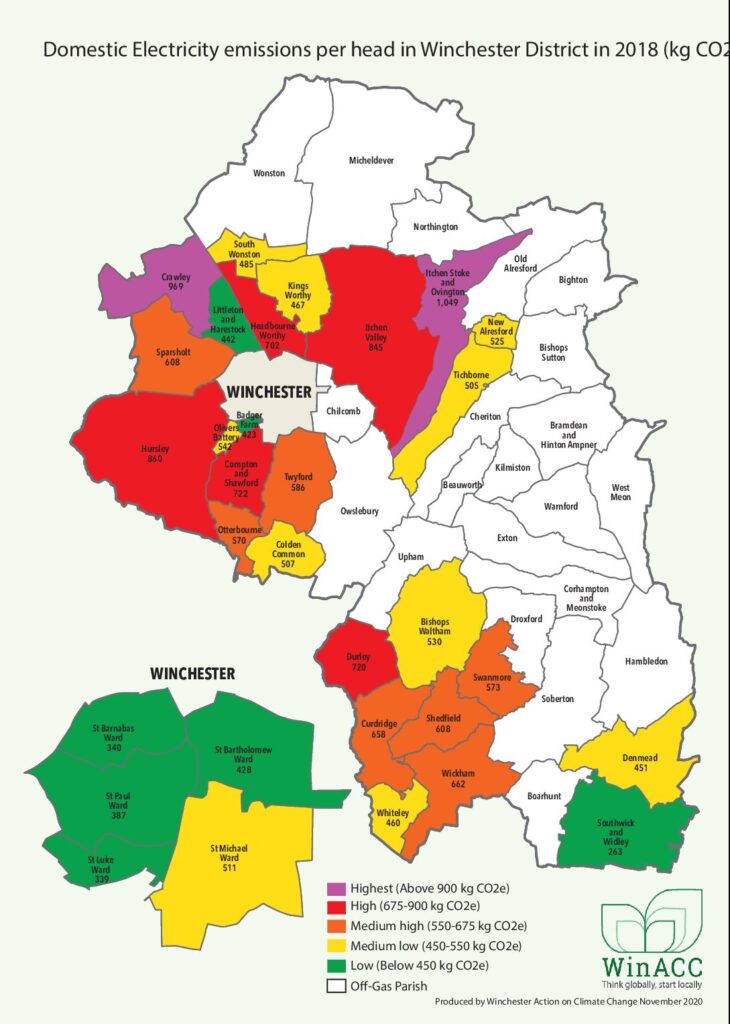
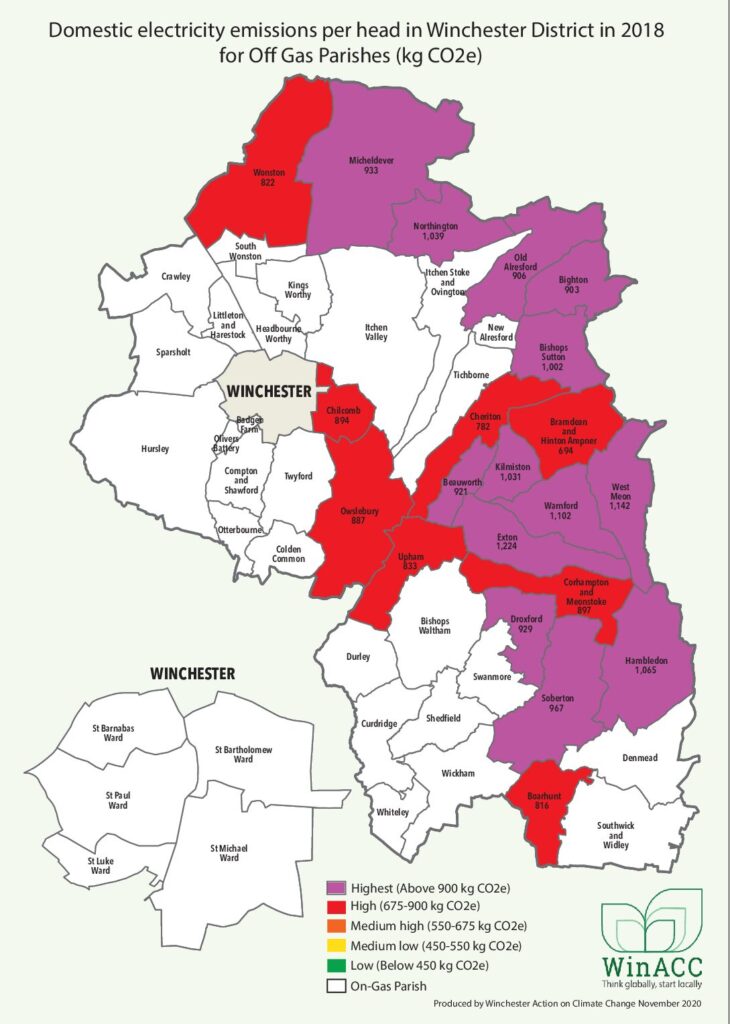
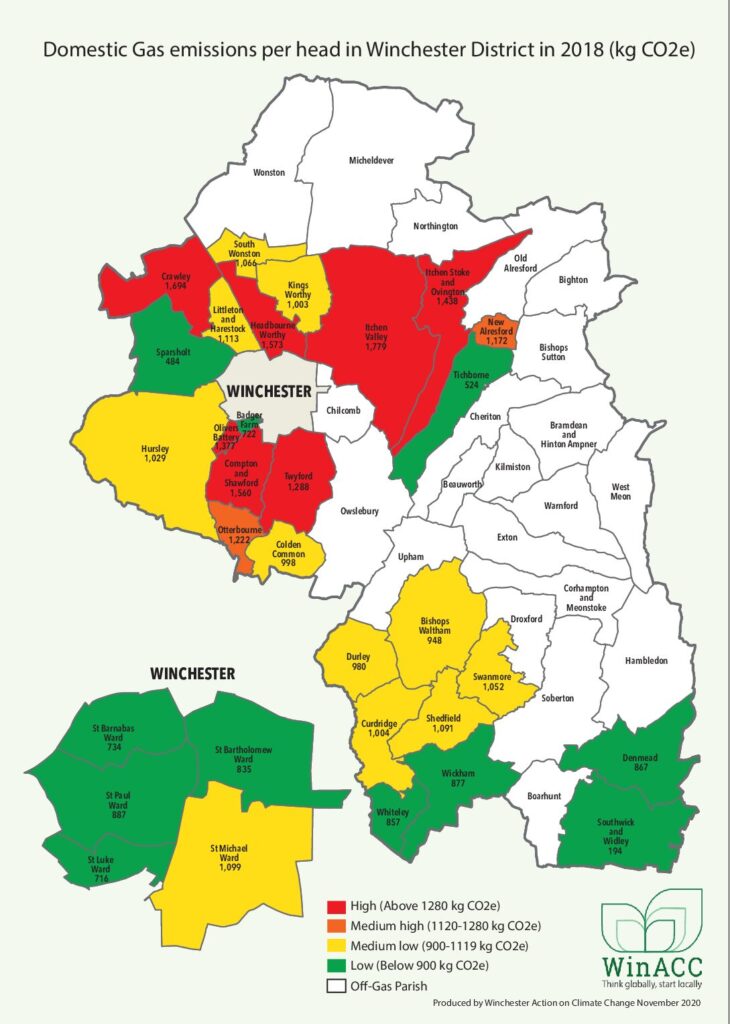
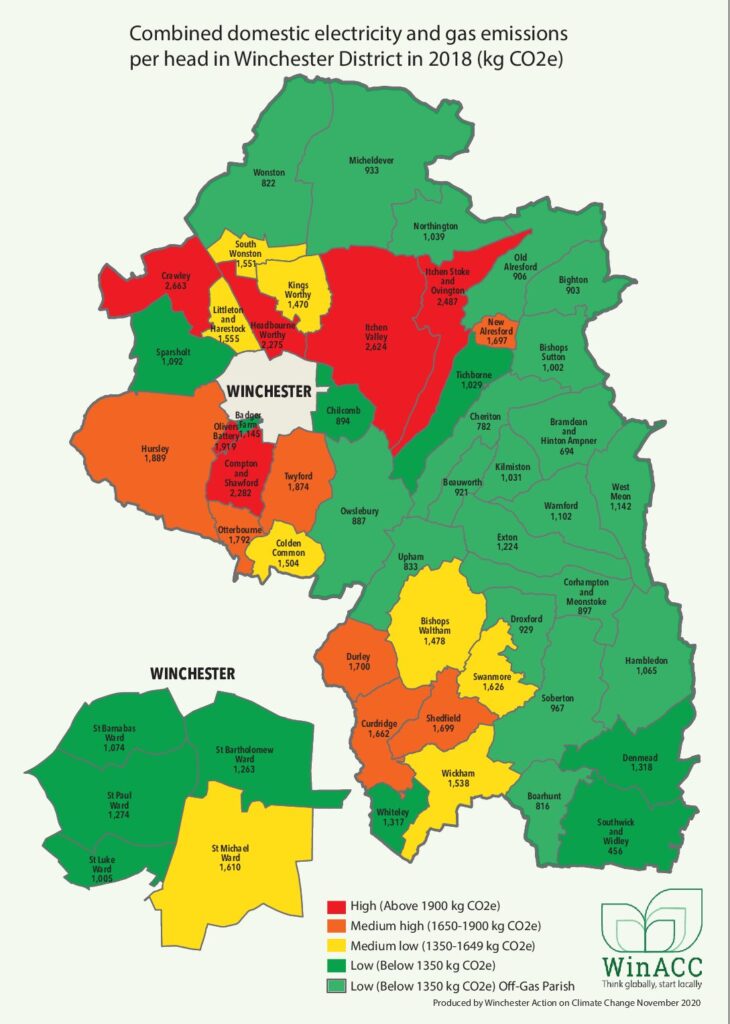
The four colour-coded maps show the average carbon dioxide emissions per person* (including children) resulting from using electricity , mains gas and heating fuels in homes in each of the 47 parishes and 5 wards** of Winchester district in about 2018. The fourth map shows the combined emissions map . All four maps are shown side by side at the top of this page illustrating how the first three have been combined to generate the fourth one.
More information
How can I use these maps?
These maps can be used in a variety of ways by parish councils, community groups and residents. The first steps are:
- Creating a benchmark of carbon emissions for your parish or ward starting in 2018.
- Now the community can take action to reduce emissions and over time, measure successes.
- In addition each household can calculate their own carbon emissions (see below) and start to reduce them, especially if they are above average on the maps for their parish.
- Working together as a community to particularly help those households who have determined that they have above average emissions – as everyone will benefit.
How can communities use these maps?
These maps present a unique opportunity for communities to discuss what local actions they can take to reduce climate change. For example:
- Parish councils will be able to compare their parish with others and ask themselves: “Why are our emissions lower/ higher than theirs?”. Compare your parish with others you might expect to have similar emissions. Why are their average emissions lower than yours? It could be down to their lifestyle, the most common type of home, their size (floor area), when they were built or even the home’s standard of insulation. Have a conversation about climate change, emissions and energy use with other parishes and learn from each other how to reduce emissions.
- Householders will be able to compare emissions of similar homes and properties by asking questions such as: “Why are our emissions different? How can we all reduce emissions?”
- Families will be able to compare their emissions (and even their energy bills) with families of a similar size and find out if the way they use their homes can reduce emissions, then share these tips with others.
How do I calculate my carbon emissions?
A. If you have mains gas
- Find your electricity bills and calculate how much electricity in kilowatt hours (kWh) you used in a recent 12 month period.
- Multiply this number by 0.253 (value for 2020). Now you know how many kilograms of carbon dioxide your home releases from the electricity you use throughout the year.
- Find your gas bills and calculate how much gas in kWh you used in a recent 12 month period.
- Multiply the annual amount of gas you used by 0.184. Now you know how many kilograms of carbon dioxide your home emits from using mains gas each year too.
- Add the two numbers together to get your home’s total annual emissions.
B. If you do NOT have mains gas
- Find your electricity bills and calculate how much electricity in kilowatt hours (kWh) you used in a recent 12 month period.
- Multiply this number you 0.253 (value for 2020). Now you know how many kilograms of carbon dioxide your home releases from the electricity you use throughout the year.
- Find the bills for a recent 12 month period for whatever fuel you use for heating (and cooking) whether heating oil, LPG, coal or logs. Then convert these numbers into the kilograms of carbon dioxide emitted by burning these fuels as follows:
- For litres of heating oil multiply by 2.540
- For litres of LPG multiply by 1.555
- For every 50kg (1 CWT) of coal multiply by 144
- For every solid cubic metre of logs multiply by 38.
- Add all your calculated emissions for electricity and the other fuels together to get your homes total annual emissions.
Estimating the emissions per person in your home for comparison with the maps
- A home’s emissions increase with the number of occupants, but they do not double for a 2-person household compared to a single person household nor triple for a 3-person household etc. We have developed correction factors which will help you get a more accurate estimate of per person emissions from your home’s total emissions.
- If you live in a 2-person household multiply your home’s total emissions by 0.72, for a 3-person household use 0.68, for a 4-person household use 0.64 and for a 5-person (or larger) household use 0.59 to get a best estimate of per person emissions for your household to compare with the mapped values.***
- Now look at the map of combined emissions and locate your parish or ward to read the average annual emissions of kilograms of carbon dioxide (kg CO2e) per person.
- The important step – Compare the two numbers! Do you produce more or less carbon emissions than the average person in your parish?
Note: you can of course compare your emissions from just electricity, gas or other heating fuels alone with the corresponding map(s), after adjusting them for the size of your household, using your sums above. But remember that consumption of these fuels will vary with your home’s circumstances, mainly whether you have mains gas. The fairest comparison is one based on the total of all the sources mentioned here.
A note on PV (solar) panels and green tariffs
If you are generating electricity with solar panels then your bills and emissions will be lower and your unused renewable electricity will be feeding the grid too – a brilliant win-win for everybody! If you are paying a “green” tariff to an electricity supplier, your emissions will be lower or non-existent, depending on the type of green tariff. Congratulations with that too!
A note on homes without mains gas
Biomass boilers using locally produced waste wood are probably carbon neutral which means they can count their boiler emissions as zero. Open wood fires and other biomass as sources of energy may be carbon neutral under certain conditions. Carbon emissions and the efficiency of wood stoves are variable. Please take a look at our scientific report from 2017, domestic wood burning stoves and also be aware of the new Regulations limiting the sale of wet wood and coal for burning in the home from 1st May 2021.
What do I do next?
Congratulations! You are one of the first people in the district to KNOW the actual carbon emissions produced by running all those electrical appliances in your home. You will also know the emissions from heating your home, cooking and providing hot water.
Climate change is a real risk to our future wellbeing, so it is essential that we all try to reduce our emissions. If your emissions are above the average for your parish you should make greater efforts to reduce your energy consumption. If it is below average for your parish, don’t let up – as the average will reduce over time as other people reduce their energy use. Suggestions are:
- Use and conserve energy at home more effectively
- Use smart meters to track down where you waste heat and energy
- Improve insulation, draughtproofing and double glazing.
- Switch to a green energy provider.
- Install solar panels to generate clean, free renewable electricity.
Advice on what to do next is available from a variety of sources:
- Winchester Action on Climate Change, Lower Your Carbon Footprint
- Energy Saving Trust, Energy at Home
- Plan Home Improvements, Simple Energy Advice
What should my community do with this information?
Use it! Highly skilled volunteers have worked hard to present this data in an attractive and accessible format. You must agree the colourful maps are attractive to look at, and they do create useful questions to ask such as: “Why do people living in my parish emit so much more carbon than people in the parish next door?” There are no easy answers, and much depends on our homes and lifestyles but it is well worth exploring this web site to find out more.
The good news is that we are ready to learn about how to live happier, healthier, low carbon lives in Winchester district.
WinACC is supporting parish councils and community groups in the district on their journeys to reducing carbon emissions by creating opportunities to learn from each other. If you are concerned about the level of emissions in your parish but don’t know where to start and you cannot find a local community group with similar interests, then email Winchester Action on Climate Change. We can help you identify like-minded people in your parish and offer support with advice and information on how to reduce emissions across the parish.
Where do these numbers come from?
Carbon dioxide emissions for domestic electricity, gas and other heating fuels at parish level are from the online Impact tool of the Centre for Sustainable Energy (CSE). Estimated parish populations in 2018 are from Hampshire County Council. Emissions per person for each parish were calculated by dividing total electricity, gas and other fuel emissions by the population of each parish.
The multiplication factors used to estimate per person emissions from household emissions for comparison with the average per head emissions in parishes were derived from a model that uses 2011 census data for the different types of household in Winchester district and estimates by the Joseph Rowntree Foundation of the emissions from such households.Important proviso
The calculated emissions per person in a home remain best estimates. In fact, gas emissions probably increase more slowly, compared to electricity emissions, as the number of occupants increases. On the other hand, electricity emissions depend more on how many appliances are in use, how many rooms have the lights on, how many hot drinks are drunk etc. which in turn depend on the number of people. This is why the emissions per person calculated above are likely to be approximate, but they are the best we can do without more data on the energy consumptions of different sized households in the district.
*The maps use kg of carbon dioxide equivalent written as kg CO2e. This means that all emitted greenhouse gases have been included but their quantity has been converted into the amount of carbon dioxide that would have the same global warming effect.
**The use of heating fuels in the five Winchester wards is likely to be essentially zero because practically all homes are on mains gas. Therefore it is assumed that electricity and mains gas are the only sources of energy. These numbers for 2018 come from BEIS.
*** These factors have been revised since the version posted in February 2021
(Updated, June 2021)