
On 4 July 2025, the government Department for Energy Security and Net Zero (DESNZ) issued the government update on greenhouse gas (GHG) emissions at local authority level for the period from 2005 to 2023 (the latest year for which data is available). The data and how it was gathered can be found at UK local authority and regional greenhouse gas emissions statistics, 2005 to 2023 – GOV.UK (www.gov.uk).
Based on the data in the DESNZ update, this reports on the history and current state of greenhouse gas emissions in the local authorities to be incorporated into Hampshire and the Solent, their patterns, and the scale of the required reduction in these emissions, touching on the broad implications of this. Detail on the solutions is beyond the scope of this paper.
We hope it will be a reference point for discussion on how the new combined strategic authority will tackle greenhouse gas emissions.
Some of the charts below contain considerable information in a small space, to fit into A4 size for printing. Readers on computer wishing to see clearly all the labels should zoom in on the charts (control / mouse wheel, or view – zoom).
A Mayoral Opportunity
The creation of a combined strategic authority in Hampshire and the Solent in 2028 provides an opportunity for the successful mayoral candidate to take an integrated strategic approach to accelerating emissions reduction across the whole area. Local efforts so far have varied in quality, ambition and impact, and as a whole the area has failed to exceed the national rate of progress. Although emissions have reduced, it is difficult to see the national target of zero emissions in 2050 being met.
This paper sets out the pattern of emissions, with a view to enabling a strategic approach to tackling emissions, especially a focus on where they are at their highest levels.
Key Points
For details, see the main report below (page 3).
- 2023 data shows that following a temporary post-Covid increase after 2020, emissions have now resumed the slowly falling trajectory from 2005 to 2019; an average reduction of under 3.4 per cent per year. Just looking at total emissions, it would seem at first glance that net zero will be reached by 2044, even if emissions associated with imports are added in. (Figure 13).
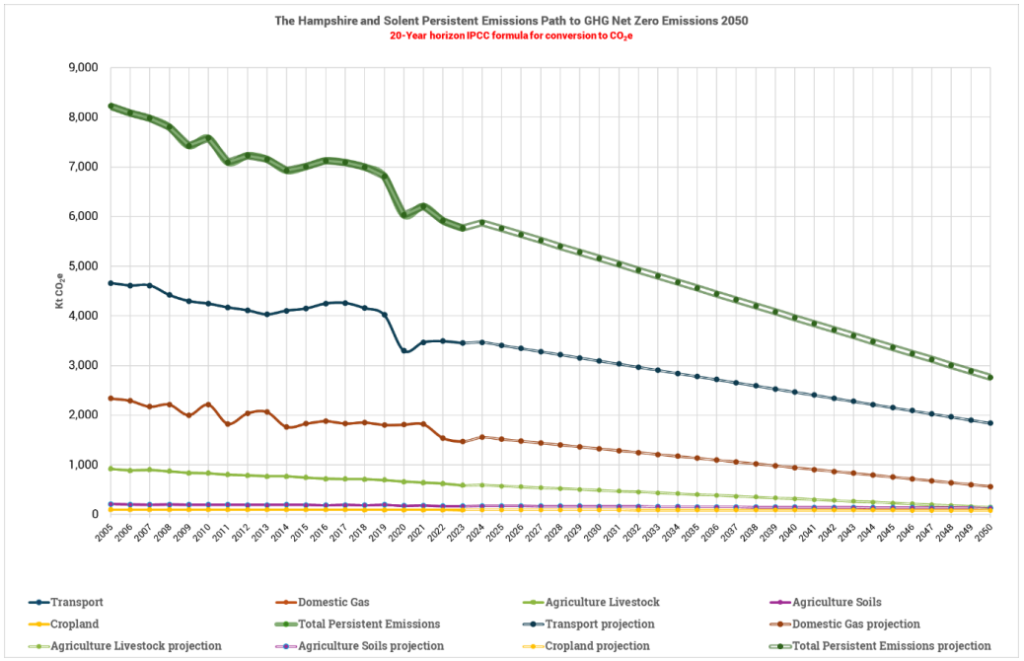
- However, this is misleading because some significant types of emissions are reducing very slowly (Figure 14), with the last (which is crop land) on course to reach zero by 2299.
- Transport emissions remain by far the largest category of emissions in Hampshire and the Solent at 43.93%, compared with the 31.82% national average. It will be catastrophic if they show no greater reduction soon (Figure 5).
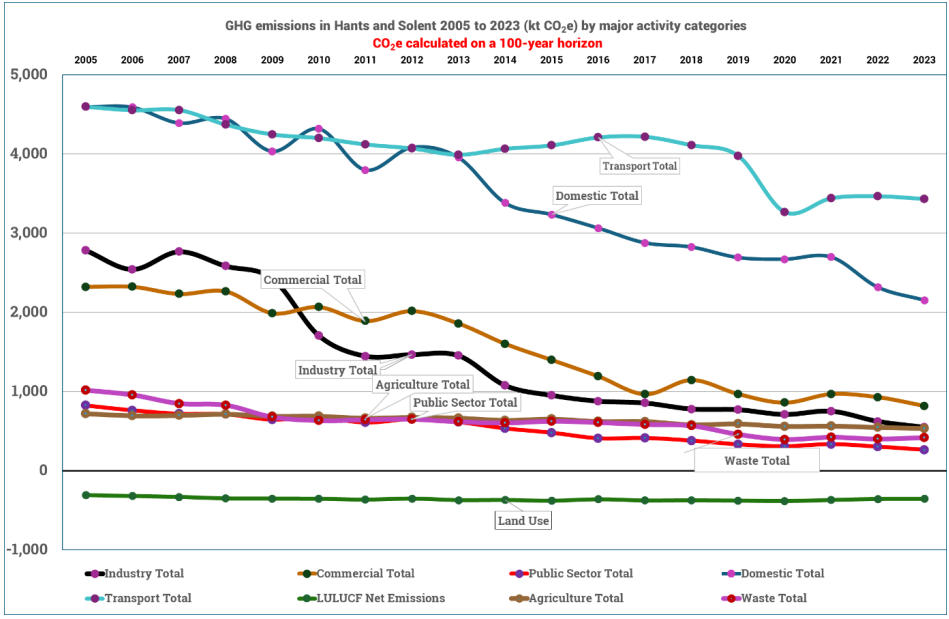
- Similarly emissions from agriculture (mostly because of livestock emissions) and waste show only a very gradual rate of reduction, requiring initiatives to accelerate their reduction.
- Domestic and commercial emissions both show a steady reduction.
- The DESNZ data show that ‘negative emissions’ (carbon removal from land use) have flat-lined (see Figure 9 Land Use line). We need to accelerate negative emissions more actively to counterbalance the sluggish reduction in other emissions.
- Emissions are usually converted to CO2e using the 100-year time frame but with some emissions this hides serious problems. Methane has three times the impact on global warming over a period of twenty years after emission, than it has, if averaged, over a period of a hundred years. If we use a timeframe of twenty years for converting methane to CO2e, methane from livestock and waste is responsible for 18% of all greenhouse gas emissions in Hampshire and the Solent (see Figure 8).
- Most energy consumed in Hampshire and the Solent comes from burning fossil fuels. In 2022 energy use in Hampshire and the Solent showed very little use of zero-carbon energy (about 10 to 13% depending on whether we include energy used in the refining/generating industries in Hythe/Fawley) (Figure 15 and Figure 16).
- DESNZ gives data on territorial emissions only. The total carbon footprint in Hampshire and the Solent results from both territorial emissions, and consumption emissions for goods and services provided from outside the UK. In 2022 consumption emissions were estimated to add 120% to territorial emissions: Carbon footprint for the UK and England to 2022 – GOV.UK
Emissions Trajectory
Impact of Covid is fading
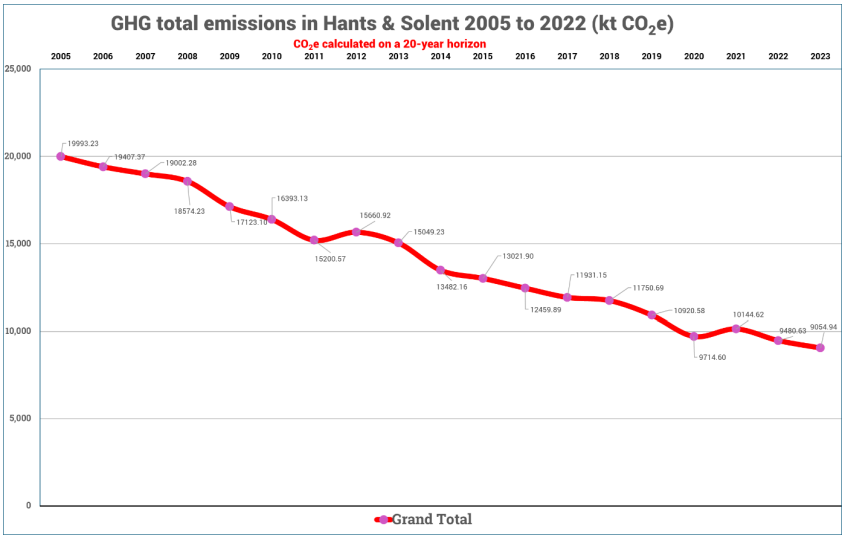
The DESNZ data showed a rapid reduction in total emissions in 2020, to 89% of the 2019 level. This was because of Covid-19 lockdown, which reduced CO2 emissions, particularly from transport.. In 2021 there was a partial increase towards the 2019 level of emissions. In 2022, emissions began to reduce again, returning to the trajectory they had had up to 2019. In 2023 this trajectory has continued.
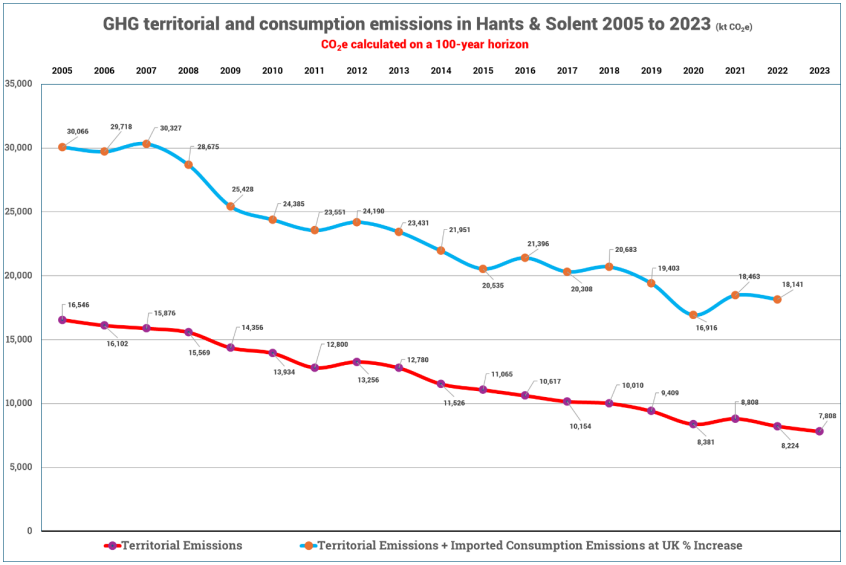
Territorial and consumption emissions
DESNZ provides local authority data on only ‘territorial’ emissions; in other words emissions that occur within an authority’s geographic boundaries.
DESNZ does not supply data on “consumption” emissions at a district, or any
sub-national level, although DEFRA does make these data available at a national level. National ‘consumption emissions’ are emissions that occur in the UK and abroad to supply the needs and desires of people within the UK. This includes many emissions caused outside the UK by growing and producing food, manufacturing goods, providing services, or generating wealth from investment.
Commissioned by DEFRA, Leeds University calculates that in 2022, emissions from greenhouse gases embedded in imported goods and services to the UK added a further 120% to domestic emissions. Data for the chart below is taken from Carbon footprint for the UK and England to 2022 – GOV.UK Figure 1.
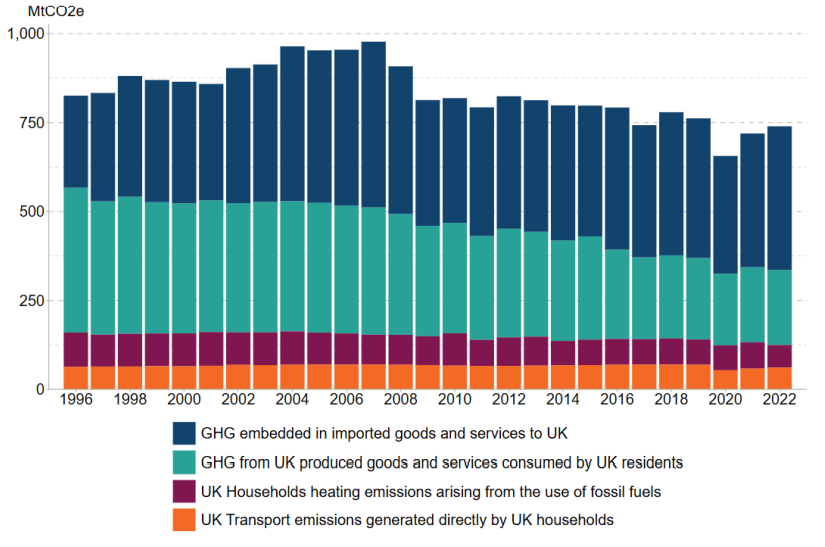
Between 1996 and 2022 there has been a total reduction of only 11% in the emissions associated with consumption emissions, both within UK boundaries and abroad. In public debate on emissions it is usually the ‘territorial’ reductions within the UK that are usually referred to. The equivalent reduction for territorial emissions over the period covered by data in figure 2 is 49%. By ignoring emissions caused by goods we import and services provided to the UK from abroad we overstate by more than four times our success in reducing emissions. This will be as true for Hampshire and the Solent as it is nationally. Unfortunately ‘consumption emissions’ data are not available at sub-national level, but we have estimated consumption emissions in Figure 3 at a level consistent with the extent they exceed territorial emissions at a national level.
The analysis that follows concentrates only on territorial emissions because details of Hampshire and the Solent consumption emissions are not available.
International transport (air and sea)
DESNZ territorial data for local authority areas do not yet include relevant emissions from air transport or shipping for commerce or leisure purposes, although they are included by Leeds University in the data in figure 2.
Hopefully, once included in territorial data, they will be assigned to local government areas in future data releases, and we will then be able to add them to the Hampshire and the Solent detailed emissions data listed here.
Converting greenhouse gases to carbon dioxide equivalents
DESNZ converts weights of methane and nitrous oxide emissions into the weight of CO2 that would have an equivalent impact on global heating. This is referred to as CO2e (e = equivalent) and is described as the global warming potential (GWP) of each greenhouse gas.
In 2023, DESNZ adopted the recommendations of the Intergovernmental Panel on Climate Change (IPCC) Fifth Assessment report (AR5) issued in 2013.
The formulae to calculate GWP vary depending on the period of time being considered because the different greenhouse gases decay naturally in the atmosphere at different rates across their lifetime.
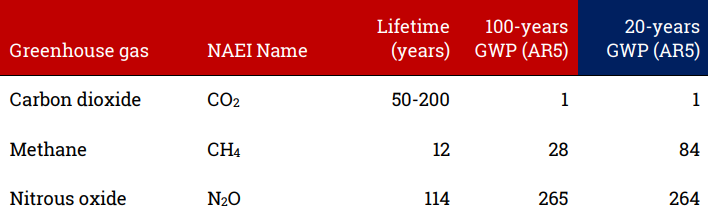
The next twenty years are crucial in our attempts to prevent global heating. We need an accurate estimate of emissions in that period. DESNZ has adopted a time horizon of 100 years for converting the emissions of methane and nitrous oxide to CO2e. Methane emissions have three times more impact on global heating over a 20-years time-horizon (it makes little difference for nitrous oxide). This is a strong argument for using a time horizon of 20 years. GWPs for a 20-year horizon are given in Figure 4 in the blue-headed column (also based on
the Fifth Assessment Report).
This report uses 100-year time horizons to maintain compatibility with DESNZ data, but where it is significant (where emissions involve high levels of methane) we refer to the alternative calculation method.
The most significant differences are that, with calculations using the 20-year horizon, agriculture and waste will both double in emissions because of the high levels of methane they contain. Compare Figure 7 and Figure 8.
Which activities cause most global heating in Hampshire and the Solent?
DESNZ divides emissions into eight major activity categories. This helps us decide priorities for making changes that will reduce emissions in Hampshire and the Solent. In 2023 activities in these categories caused the following emissions:
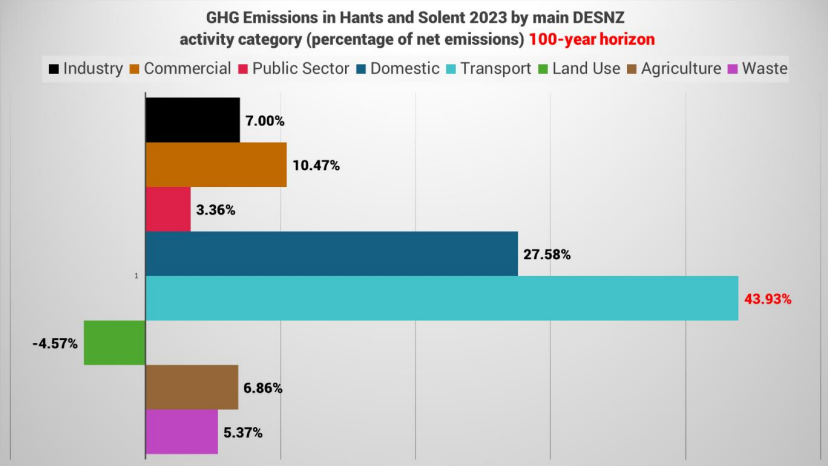
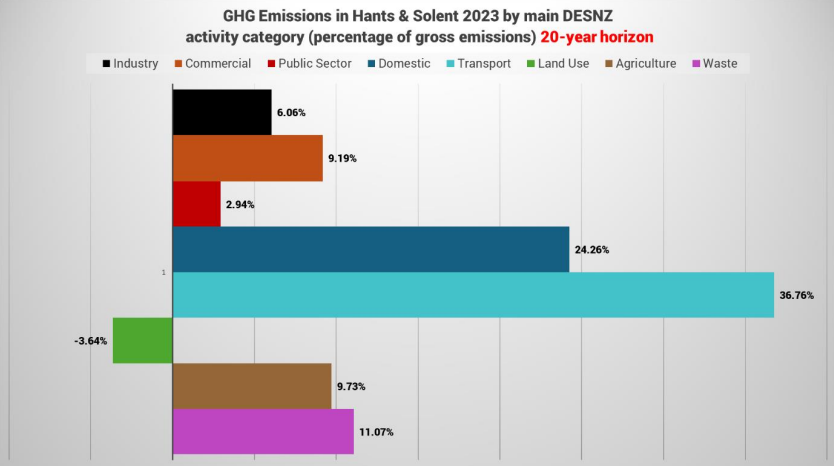
‘Transport’ is by far the largest category, responsible for nearly half the proposed authority’s emissions, followed by ‘Domestic’.’
These main categories break down into the following sub-categories:
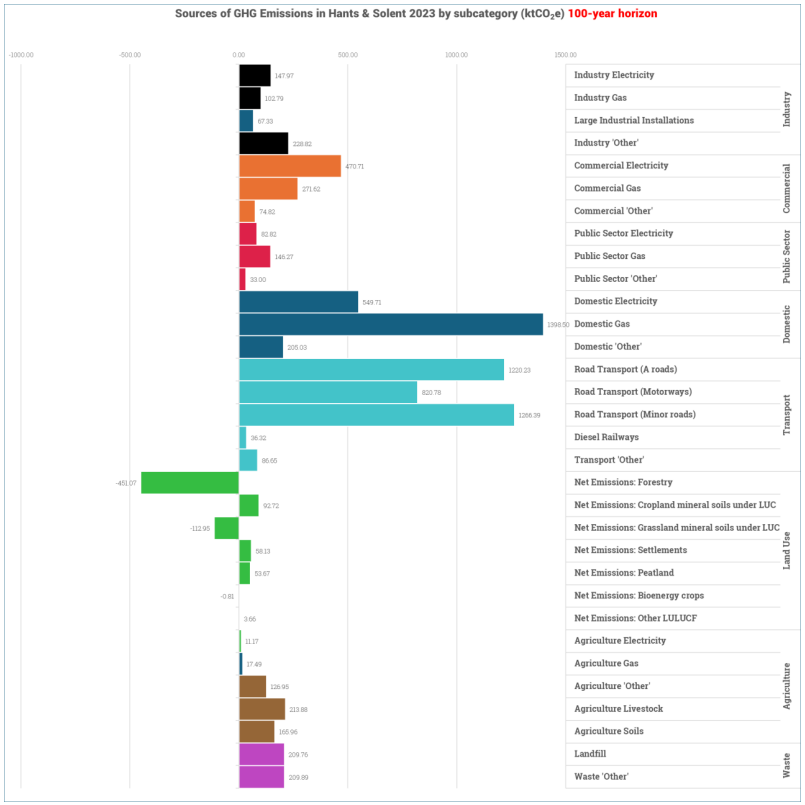
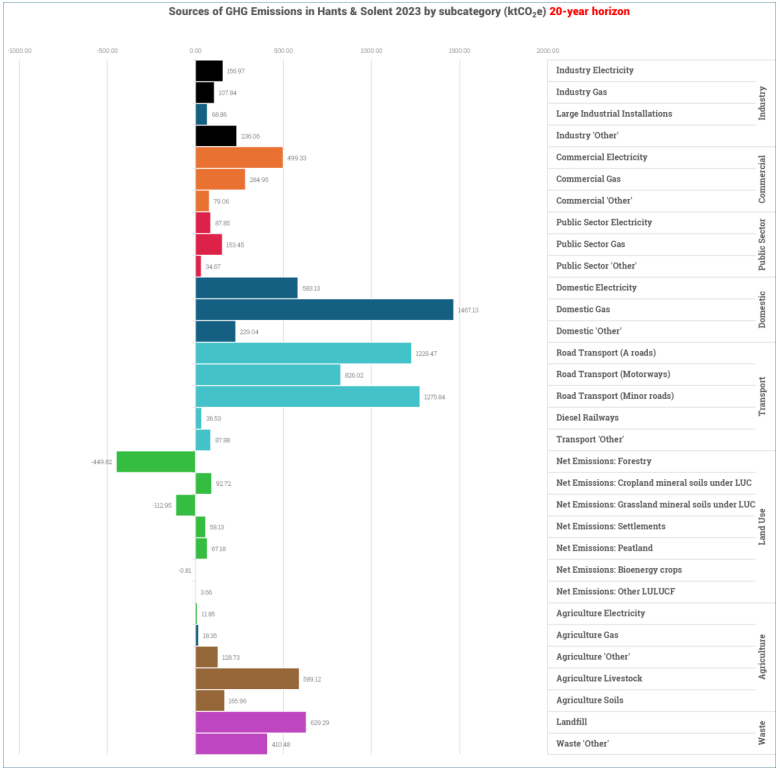
If this table were to be recalculated for a 20-year emissions horizon, waste would become the fifth most significant sub-category and agriculture (livestock) the sixth most significant, because of the methane emissions
produced: When we calculate emissions in this way, it is clear that waste and livestock require intensive attention and action.
Is there any good news?
Negative emissions help reduce the total emissions in Hampshire and the Solent. Forestry, and to a lesser extent grassland, absorb greenhouse gases, but together are not even enough to counterbalance agriculture emissions. Negative emissions do not increase as quickly as we need them to, despite all the references that are made to ‘offsetting,’ often by planting trees.
How quickly are emissions reducing?
Figure 9 shows the different rates at which the emissions for each of the main categories are reducing over the years. The major factor appears to be the decarbonisation of the electricity supply. There is now the need to decarbonise all energy, in line with the government’s priorities.
How do Hampshire and the Solent’s emissions compare with national average?
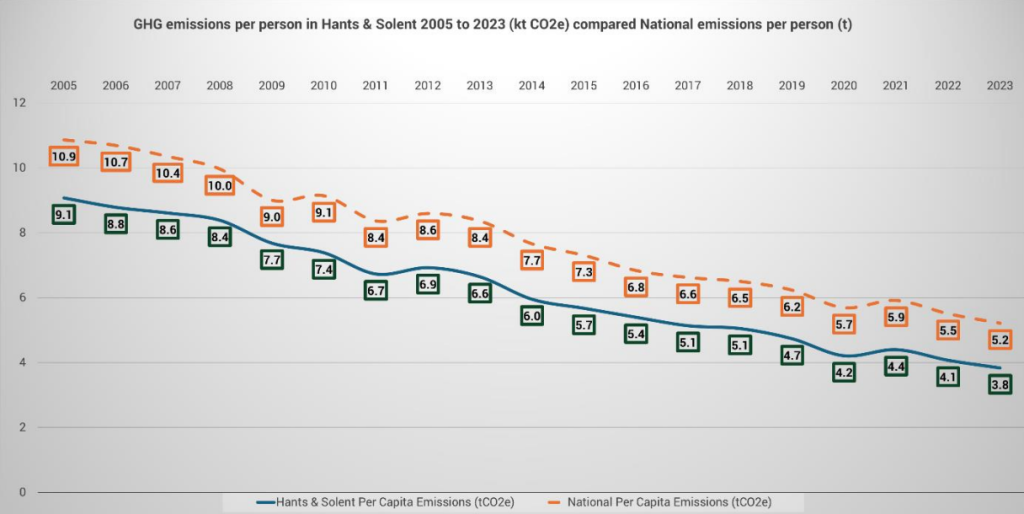
Throughout the period between 2005 and 2023 emissions per person in Hampshire and the Solent have been slightly lower than average emissions per person across the country. Generally emissions per person are higher per person in rural areas and lower per person in urban areas. Emissions have followed the national pattern of increase and decrease closely over the years.
How do emissions in historic Hampshire and the Solent local government areas compare?
All areas follow similar overall trajectories (Figure 12) apart from the rapid emissions reduction that resulted from pre-2014 reduction in heavy industry in the Waterside area.
Some areas have consistently relatively high emissions, and some areas consistently low. Test Valley, Winchester, East Hampshire, and Basingstoke and Deane probably have high emissions because they are crossed by major roads. This would highlight the need for strong strategic transport policies to reduce long-distance traffic flows.
Over the period the rate of reduction in emissions has shown significant differences across the current local authorities:
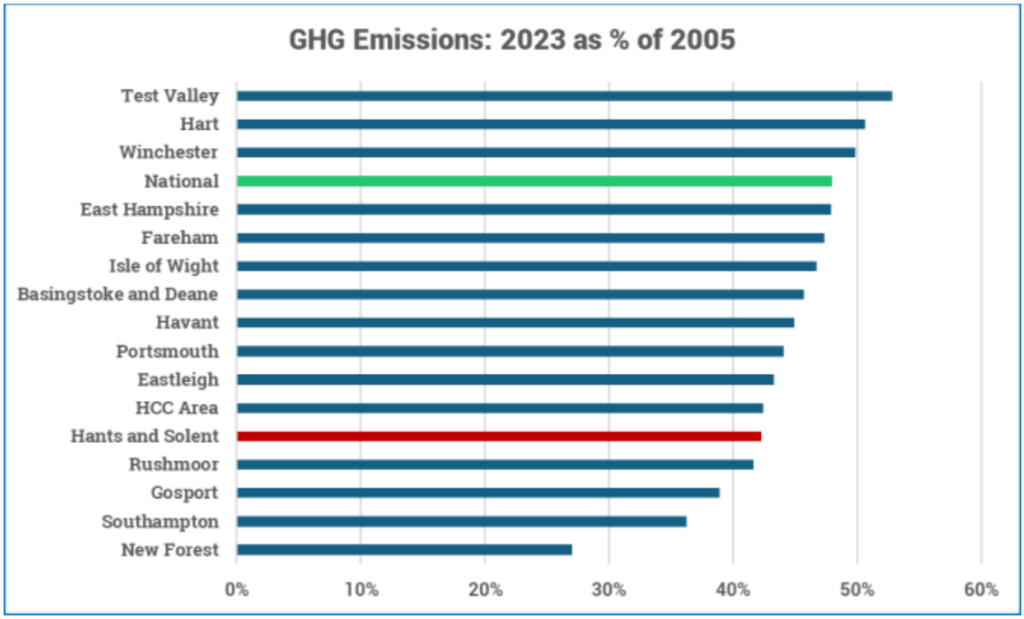
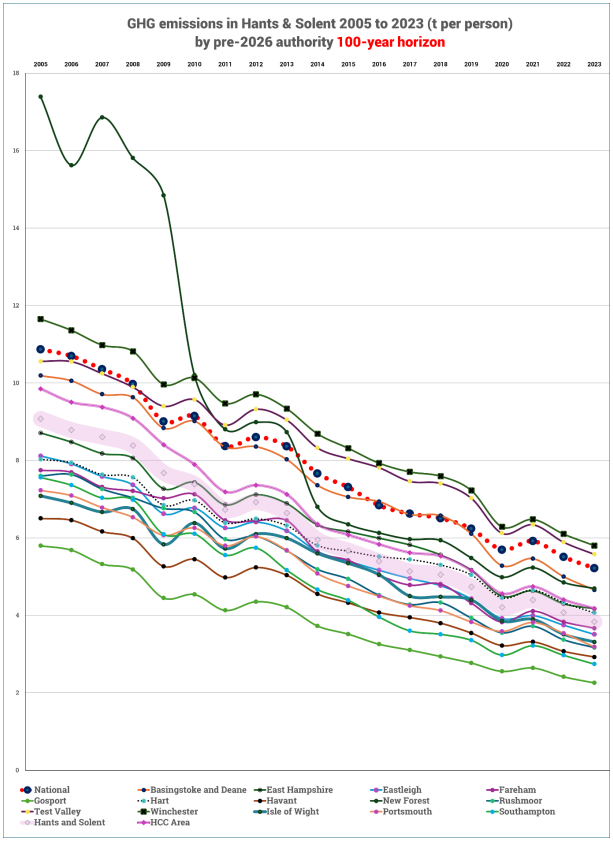
Figure 13:
- looks at the rate of total greenhouse gas emissions reduction between 2000 and 2023
- assumes that emissions for 2024 onwards will be a return to ‘business as usual’, basing an arithmetical projection on the historic trajectory 2005 to 2022, and then
- charts the trajectories for both territorial and consumption emissions indicated by past patterns.
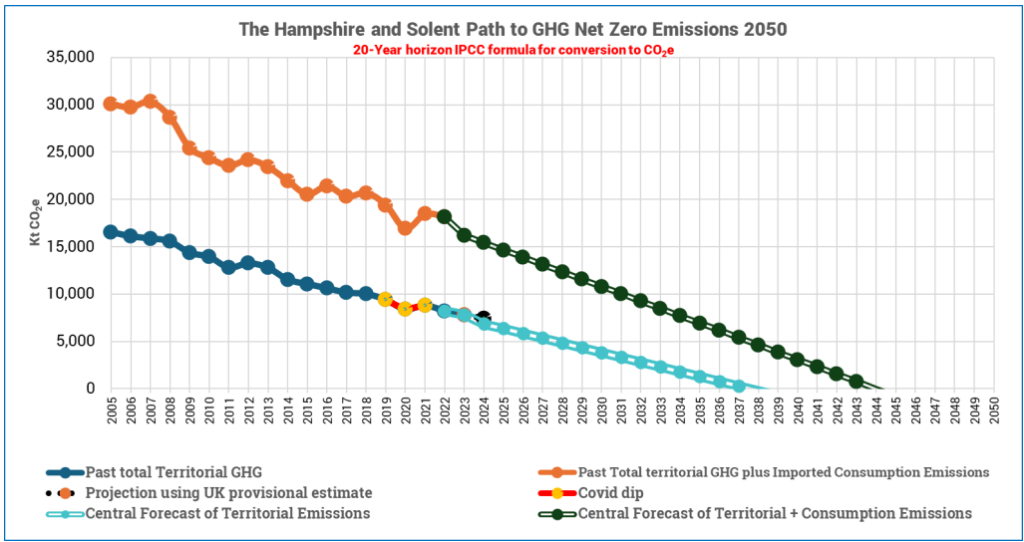
The prediction of zero emissions by 2038 for territorial emissions, and 2044 for territorial + consumption emissions, initially looks a cause of hope. Unfortunately it disguises the fact that some emissions are disproportionately persistent and show no sign of reducing at the overall rate (Figure 14).
Some types of emission show no sign of reducing to zero until far into the future:
- livestock by 2060
- domestic gas by 2065
- transport by 2080
- soils by 2125
- cropland by 2300.
All of these will require significant interventions.
Energy Sources
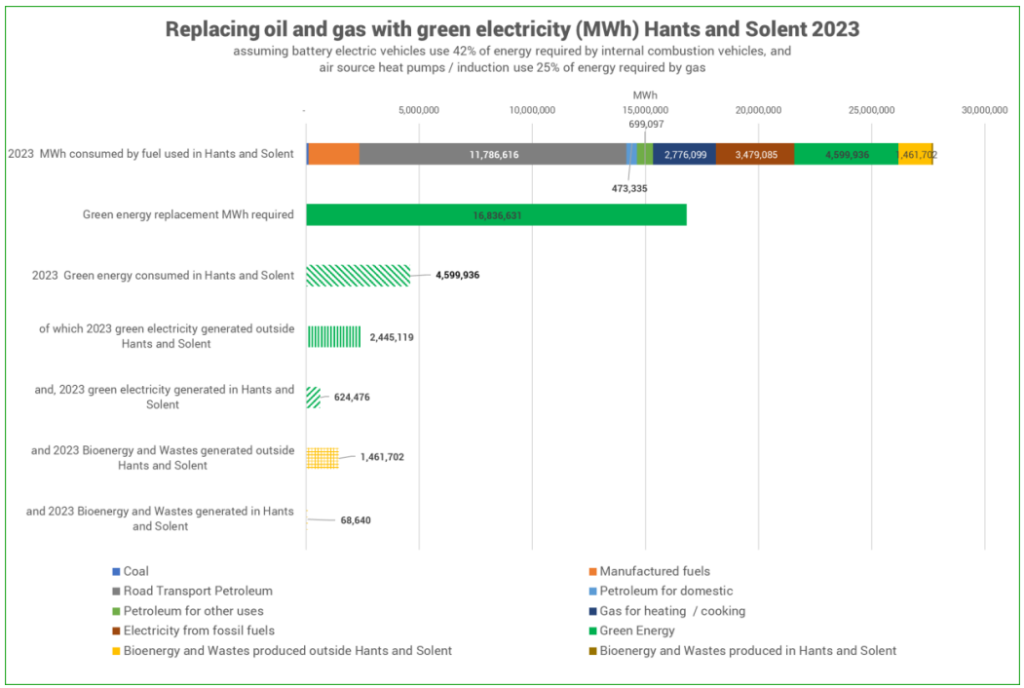
Most energy consumed in Hampshire and the Solent comes from fossil fuels. Emissions will not reduce unless we switch to using zero-carbon sources of energy. The balance is changing only slowly towards renewables. In 2023 energy use in Hampshire and the Solent still showed very little use of zerocarbon energy (about 10 to 13% depending on whether we include energy used in the refining/generating industries in Hythe/Fawley that produce energy consumed outside Hampshire and the Solent widely across the south of England):
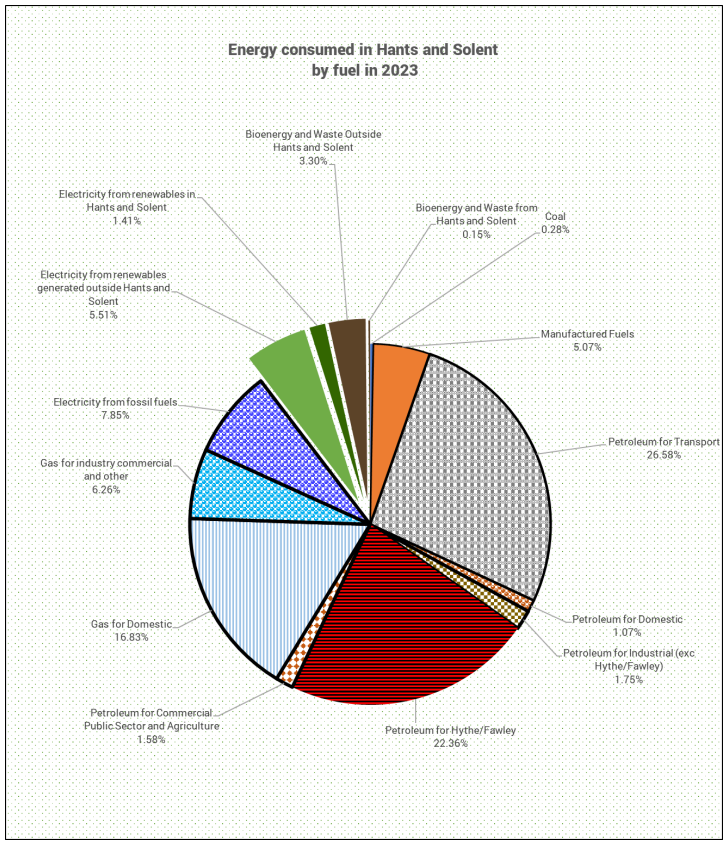
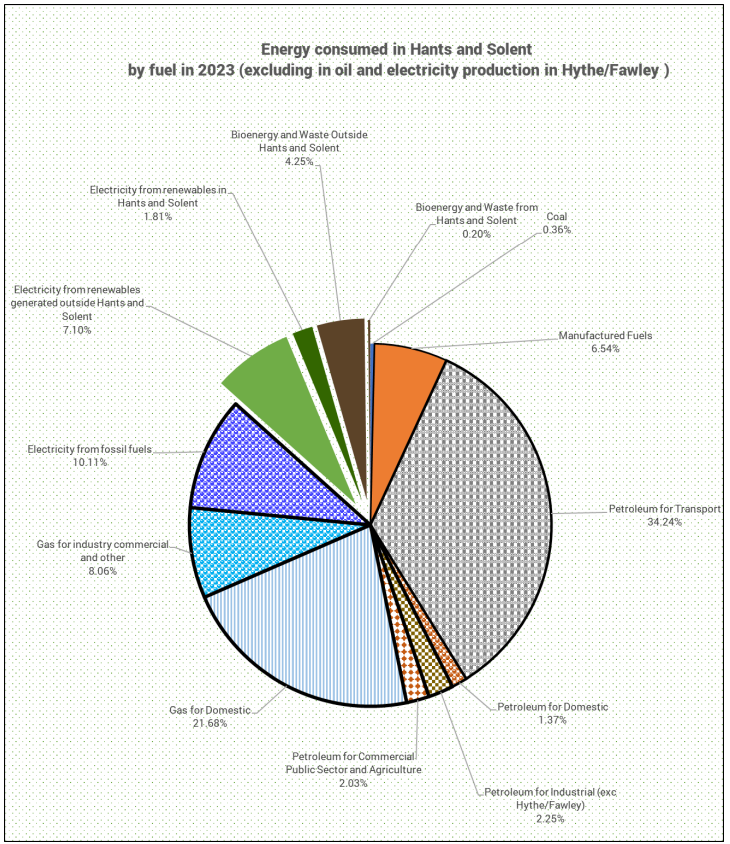
Data in Figures 15 and 16 from DESNZ Total final energy consumption at regional and local authority level: 2005 to 2022 – GOV.UK (www.gov.uk) 31 July 2025
Appliances powered by electricity use energy more efficiently than appliances using other sources of energy, so it is difficult to be precise about how much green energy we would need to replace fossil fuels in the combined authority. Initial estimates suggest we would need at least four times more green electricity to replace fossil fuels as a source of energy. To provide all our energy needs from electricity produced within Hampshire and the Solent boundaries, we would probably need to produce at least twenty-four times more than is currently produced.
Read this report as a PDF here.
Phil Gagg 19 December 2025