
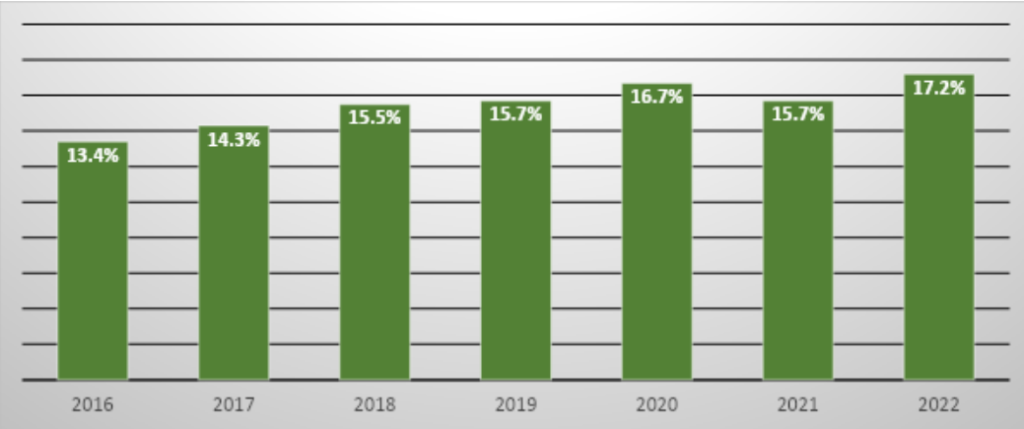
Figure 1: Contribution of local generation to local demand for electricity
This report is the third in our series of annual summaries of data on installations generating energy from renewable sources in our District. It supplements WinACC’s annual reports on Greenhouse gas emissions in Winchester District.
The report is presented by WinACC’s Renewable Energy Action Group.
Feedback: renewables@winacc.org.uk
Read this report as a PDF here.
Introduction
Renewable electricity generation capacity in the pan-Hampshire area in 2021 was 706MW. Of this, 88% was photovoltaics with 185 MW in Test Valley, 97 MW in Winchester, 93 MW in Isle of Wight and 50MW in East Hampshire districts but with little other installed renewable electricity generation capacity. This 706MW of capacity generated 625 GWh in 2021, or just ~8% of the 7,520 GWh of electricity used in pan-Hampshire in 2020.
Events of the last two years could hardly have done more to motivate greater ambition within UK households and businesses to reduce their dependence on the national electricity grid. Soaring and highly volatile costs in that period, largely driven by geopolitics and international energy markets, have ramped-up awareness that local UK solar and wind resources can satisfy a growing demand for an electricity supply that is secure and stable, while remaining affordable. In the Winchester district, the table above demonstrates that local supply of electricity is making less than a 20% contribution to local demand. Despite a modest increase in that percentage during 2022 (the last year for which data is available due to lagged reporting), our district is importing most of its electricity, despite the sharply rising trend of domestic solar installations. Most of the renewable electricity generated in our district is from solar farms because rooftop PV installations are very small, and although more are being fitted, the overall output is very low by comparison to a solar farm.
If our district is to achieve the government target of decarbonising the electricity grid by 2035, we will need rapid growth in solar and onshore wind generation to accompany other renewable energy solutions. All these technologies will require multiple local sites. To achieve future targets for renewable electricity production which does not rely on fossil fuel sources and given the enormous time-lag and dramatic national cost of ramping-up nuclear energy to any significant level, it seems only reasonable to encourage rural districts to aspire to match local supply with local demand, whilst encouraging our towns to maximise their rooftop solar PV. It is notable that the UK energy crisis has also boosted public support for large scale renewable projects, evidenced through a question about energy infrastructure included in the government’s Public Attitudes Tracker during 2022. The survey found that 81% of respondents said they would be ‘very happy’, ‘fairly happy’, or ‘would not mind’, if a solar farm was constructed in their local area.
If we are to achieve the levels of expansion for solar energy envisaged in the 2022 British Energy Security Strategy, and in the 2023 analysis by the UK Climate Change Committee, every rural district will need to play its part. WinACC has urged Winchester City Council to commit to a rapid scaling up of the modest progress recorded in this document.
This report should be of interest to all those encouraging and implementing renewable generation of electricity in the Winchester District, crucial to decarbonisation of the electricity grid and our vision of a net-zero District.
Contents
- Rooftop solar PV
- Solar farms
- Other technologies
- Local generation of electricity
- Local consumption of electricity
- Progress?
Rooftop Solar Photovoltaic (PV)
The primary source for the data in this table is the MCS Data Dashboard. This source excludes installations larger than 50kW, with the data relating almost entirely to rooftop pv panel systems, as opposed to ground-based PV panel systems.
Solar PV is the familiar “photovoltaic” solar panel technology that converts sunlight into electricity. It is distinct from “solar thermal” rooftop technology which delivers energy to heat water.
Rooftop solar PV installed in Winchester District 2019-2023:
| New installations | Average cost (£) | Average cost per kilowatt (£) | Average kilowatt capacity | Total new kilowatt capacity | Total new MW capacity | |
| 2019 | 321 | 4,512 | 1,533 | 2.9 | 945 | 0.945 |
| 2020 | 302 | 4,804 | 1,563 | 3.1 | 928 | 0.928 |
| 2021 | 574 | 6,910 | 1,868 | 3.7 | 2,123 | 2.123 |
| 2022 | 779 | 7,421 | 1,741 | 4.3 | 3,320 | 3.320 |
| 2023 | 953 | 11,072 | 2,054 | 5.4 | 5,137 | 5.137 |
| 5-year total | 2,929 | 12,453 | 12.453 |
- The “capacity” of an installation is the energy generated when operating at maximum output. One “kilowatt” is the amount of energy required for a domestic appliance such as an iron or fan heater.
- A 4 kilowatt home system typically requires 10 solar panels, depending on specification. The final two columns have been derived from the first three columns which draw data directly from the database. This may not be a precise reflection of the underlying data.
- Domestic and non-domestic properties are included together here, as the distinction between them is not entirely clear in the published figures. Installations on new housing estates may be excluded.
- Note: the average cost per kilowatt includes the effect of inflation, which is the main cause of the increase in average cost over this period (cumulative CPI inflation between 2019 and 2023 was in excess of 20%, and some solar pv costs have risen at rates above normal CPI inflation).
Although the strong growth pattern of rooftop PV installation over this period has continued into 2023, the database currently reveals a significant fall in monthly installations in the second half of that year. Nonetheless, Winchester remains a leading district in taking advantage of roof mounted solar potential, both within Hampshire and nationally, as this table shows:
Percentage of households installing solar PV:
| 2019-2023 | 2009-2023 | ||
| Eastleigh* | 6.0% | Eastleigh* | 11.7% |
| Winchester* | 5.7% | Winchester | 10.9% |
| East Hampshire* | 3.9% | East Hampshire | 10.6% |
| Test Valley | 2.4% | Test Valley | 6.3% |
| Basingstoke and Deane | 2.2% | Basingstoke & Deane | 5.2% |
As MCS data excludes installations larger than 50kW, some important commercial developments are not recognised in these tables. Local rooftop installations larger than 50kW operational by the end of 2023 that are known to WinACC are:
- Sparsholt College
- Winchester Sport and Leisure Centre
- Vaultex car park (Winchester)
- Marwell Zoo
- Biffa Waste (Winchester)
- Twyford School
There are no known community energy installations of solar PV in Winchester District.
Rooftop solar PV is very welcome and the positive trend in numbers of households installing this is encouraging. Nevertheless, the gross output of rooftop solar electricity from rooftop pv panels, compared with the gross output from solar farms is very small (circa 3%). Community Energy helps galvanise collective ambition into action in achieving slightly larger projects then individual household pv can achieve. However, even with a strongly committed community, the scale and pace of installation, means it would be dangerous to assume they offer a strategically significant means of addressing the imperative to achieve 100% generation of electricity in the district in a timely way.
Solar Farms
Operational solar farms in Winchester District at the end of 2022:
| Address | Parish | Operator | Operational | Installed Capacity (MW) |
| Raglington Farm, Botley Road, | Shedfield | Next Energy Solar Fund | 2013 | 5.8 |
| Whitehill Lane, Alresford | Bishop’s Sutton | Lightsource Renewable Energy | 2014 | 12.0 |
| Southwick Estate, Belney Lane | Southwick | Bluefield Solar Income Fund | 2015 | 48.0 |
| Field House Farm, Hursley | Hursley | Foresight | 2015 | 6.4 |
| Winchester Road, Bishops Waltham | Bishop’s Waltham | Solafields | 2017 | 6.0* |
| Forest Farm, Winchester Road, Waltham Chase | Bishop’s Waltham | Next Energy Solar Fund | 2017 | 3.0 |
| Total: 81.2 |
Source: DESNZ Renewable Energy Planning Database: January 2024
In February 2023 the new 25MW solar farm operated by Enviromena at Three Maids Hill in Headbourne Worthy parish was commissioned and started producing power.
Solar Farms in the pipeline
Planning permission granted:
- 18MW for Next Power at Locks Farm, Bishop’s Waltham (March 2023)
- 20MW for Novus Renewable Services at the South Lynch estate, Hursley (February 2024)
- 3MW at Moorshill Farm, Fontley Road, Titchfield. Construction commenced in 2020 but is not complete.
- Portsmouth Water has planning permission for a 1.5MW ground-based solar development at the World’s End Pumping Station in Denmead parish.
Applications submitted (awaiting planning decision):
- 50MW for Enso at Denmead Farm in Denmead parish. The site is shared with East Hampshire district.
Applications pending (screening opinion complete):
- 69 hectares for Conrad Energy (via Aardvark Energy’s Screening Application) at Titchfield Lane, in Wickham parish
Projects in early design stage:
- 22ha hectares for Ethical Power for a 10 MW installation at Glebe Farm, Waltham Chase.
Project Withdrawn:
- In September 2023 the application for a site at the former Funtley Landfill, Titchfield Lane for a 10MW solar farm was withdrawn.
Other Technologies
Battery Energy Storage
Operational
- 10MW for Winchester Power on land adjoining Harestock Sub-Station off Stockbridge Road, Winchester.
- 17MW for Conrad at Down Farm, Hursley
Planning permission granted
- 64MW for Balanced Grid Solutions on land South of Ash Farm, Titchfield Lane, in Wickham parish.
Applications pending (screening opinion complete)
- 50MW for Winchester Energy Reserve Limited at Silkstead Farm, Hursley.
Anaerobic digestion
Anaerobic digestion produces gas from biological sources including animal manures, crop residue, grass, and some harvested crops. Whilst this biogas can be used to produce electricity, most tends to be either injected into the national gas grid or used for vehicle fuels or used in manufacturing.
Planning permission granted:
- Sparsholt College: 60,000 tonnes/annum bio digester at the college campus. Not yet constructed.
- Acorn Bioenergy; Three Maids Hill, 83,000 tonnes/annum bio digester adjacent to the new solar farm (Section 2 above). Under construction with intended use primarily for injection into the national gas grid with some used for vehicle fuel connected with the operation of the facility.
Solar Thermal
There are 192 installations of solar thermal technology registered for Winchester District in the MCS database, mostly dating from 2011-2016.
Wind, Hydro and Biomass
There are less than ten registered installations for these technologies combined and they are all very small.
Local generation of electricity
Generation of electricity in Winchester District (GWh per annum)
| Total Solar Farms at year end | Total Small Installations at year end | Total Installed Capacity (MW) | Annual Generation (GWh) | |
| 2016 | 4 | 1,935 | 82.8 | 79.8 |
| 2017 | 6 | 2,021 | 92.4 | 85.6 |
| 2018 | 6 | 2,173 | 93.0 | 92.1 |
| 2019 | 6 | 3,027 | 95.3 | 91.7 |
| 2020 | 6 | 3.329 | 96.1 | 92.5 |
| 2021 | 6 | 3,903 | 97.5 | 87.9 |
| 2022 | 6 | 4,678 | 100.3 | 94.4 |
These figures are all solar PV. Installations of other technologies are too small to register on this scale.
Annual solar generation is determined by the impact of the radiation of the sun (insolation) which varies from year to year, occasionally by as much as 10%. This explains the dip in generation in 2021, despite the increased capacity available.
The new Three Maids Hill solar farm will make a full contribution to the 2023 data for the first time. The operators (Enviromena) hope to add over 29GWh to annual local generation, potentially boosting the 2022 figure by over 30%.
Sources (DESNZ, formerly BEIS): Regional Renewable Statistics (September 2022).
Solar Farms in Winchester District (Section 2 above).
Local consumption of electricity
Electricity consumption in Winchester District (GWh per annum)
| Domestic | Non-domestic | Total | |
| 2016 | 229.4 | 364.0 | 593.4 |
| 2017 | 228.0 | 369.4 | 597.4 |
| 2018 | 226.5 | 368.4 | 594.8 |
| 2019 | 227.0 | 357.0 | 583.9 |
| 2020 | 244.4 | 311.1 | 555.5 |
| 2021 | 236.2 | 323.3 | 559.5 |
| 2022 | 218.5 | 331.2 | 549.7 |
There were 56,161 domestic meters and 5,934 non-domestic meters in Winchester District at the end of 2022. The number of domestic meters has increased by about 10% over this period. There has been a modest decline in local demand for electricity.
Source (DESNZ, formerly BEIS): Local Authority Electricity Consumption Statistics (January 2024)
Progress?
The final columns of the two tables above demonstrate that local supply of electricity makes a very small contribution to local demand. Our District is importing most of its electricity.
Contribution of local generation to local demand for electricity
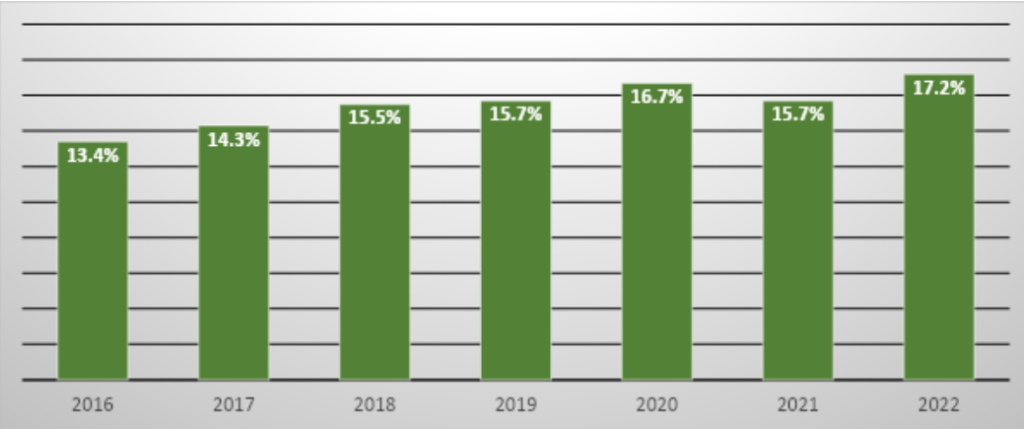
2022 is the latest year for which the relevant data is available. Growth in the contribution of local generation is very sluggish, despite the sharply rising trend of domestic solar installations.
If we are to achieve the government’s target of decarbonising the electricity grid by 2035, we will need rapid growth in solar and onshore wind generation to accompany other renewable energy solutions. All these technologies will require multiple local sites.
Importing this proportion of our electricity from outside the Winchester District at the current scale in effect amounts to expecting others to achieve these targets on our behalf, given that all districts struggle to find suitable sites for solar farms and wind turbines. In this scenario, it seems only reasonable to encourage all rural districts to aspire to match local supply with local demand.
A fuller analysis of the data in this report has been published independently (see the link here:
https://waitingtocreditmarvels.net/renewable-energy-in-winchester-district-2024-report/ ) by Bill Gunyon.